Foresee the drift from
the stable region.
toorPIA: a dimensionality-reduction engine that maps high-dimensional data faithfully onto a 2D map
On that map, the normal “stable state” forms a single region — so when data starts drifting away from it, you see the first sign of collapse. Even as sensors multiply and data columns pile up, the whole picture stays intact: our standard pipeline keeps states distinguishable up to 6,000 dimensions (verified in an open benchmark), so even the faintest warning stays visible.
New ResearchMapping the mind of an LLM — internal-state visualization→6000dims
States stay distinguishable even as data columns (dimensions) grow
toorPIA's standard analysis pipeline keeps states distinguishable even when irrelevant (noise) signals are mixed in: with only 3 meaningful columns in the data, state accuracy stays above 0.99 up to 768 dimensions, 0.95 at 2,000, and 0.82 even at 6,000. Verified in an open benchmark.
O(n)
Linear complexity
Hundreds of thousands of points in under 1 min
0
Tuning parameters
No knobs to tune — just feed it your data
CPU Only
No GPU needed — hundreds of thousands of points in under a minute on CPU alone
Ranked first overall on 5 of 6 datasets. Our performance claims can be verified by anyone — the code, data, and all results are published as an open benchmark, and the methodology and headline results are also available as an arXiv preprint (arXiv:2608.21779).See the open benchmark→
From high-dimensional space to 2D
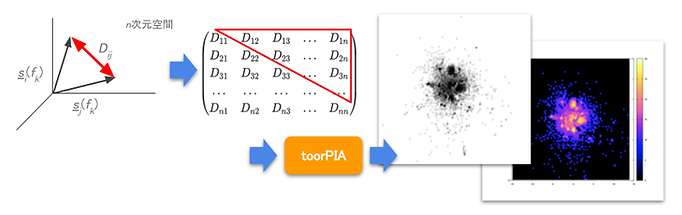
From the distance structure of n-dimensional data, toorPIA projects a 2D heatmap/scatter plot
Avoids distance concentration
In high dimensions, all pairwise distances become uniform, erasing the distinction between "near" and "far." toorPIA circumvents this structural issue by directly preserving global Euclidean distances.
Preserves intermediate regions
The transitional states between normal and abnormal are where early signs of anomalies first appear. Methods that rely on nearest neighbors alone (k-NN based) pull clusters together and sever these in-between states. toorPIA preserves the intermediate regions seamlessly — the key to predictive monitoring.
Retains time-series continuity
Equipment condition changes over time. Conventional methods break or tangle these trajectories, but toorPIA faithfully reproduces the flow of time and direction of change in 2D — catching signs of degradation before they escalate. Our open benchmark backs this up: on a 50-dimensional random-walk dataset, toorPIA ranked first of eight methods on all three distance-fidelity readouts.See the results →
Three products tailored to your needs
vibeCheck
Conveyors, gearbox low-speed stages, agitators, cooling tower fans —the slower a machine turns, the less conventional vibration diagnosis has to work with. vibeCheck chases no particular frequency; it judges by how far a recording sits from a base map built during normal operation. Keep the unit in the office and record during daily inspection rounds, using an iPhone or off-the-shelf gear.
Built for low-speed machinery / No fixed sensors / Edge-complete
Learn more →toorPIA API
Offers toorPIA's dimensionality reduction and precursor monitoring as a REST API. From basemap creation to new data projection and quantification of transitional states from the normal region, it integrates seamlessly into your existing pipelines.
Batch & streaming modes / LLM integration via MCP server
Learn more →Create base map
Project new data
Get diagnosis
Analysis Package
An on-premises analytics platform that provides toorPIA within a JupyterHub + JupyterLab environment. Installed on your private cloud, it enables your data scientists to interactively explore and analyze high-dimensional data from their browsers.
Runs on Docker / Multi-user support
Learn more →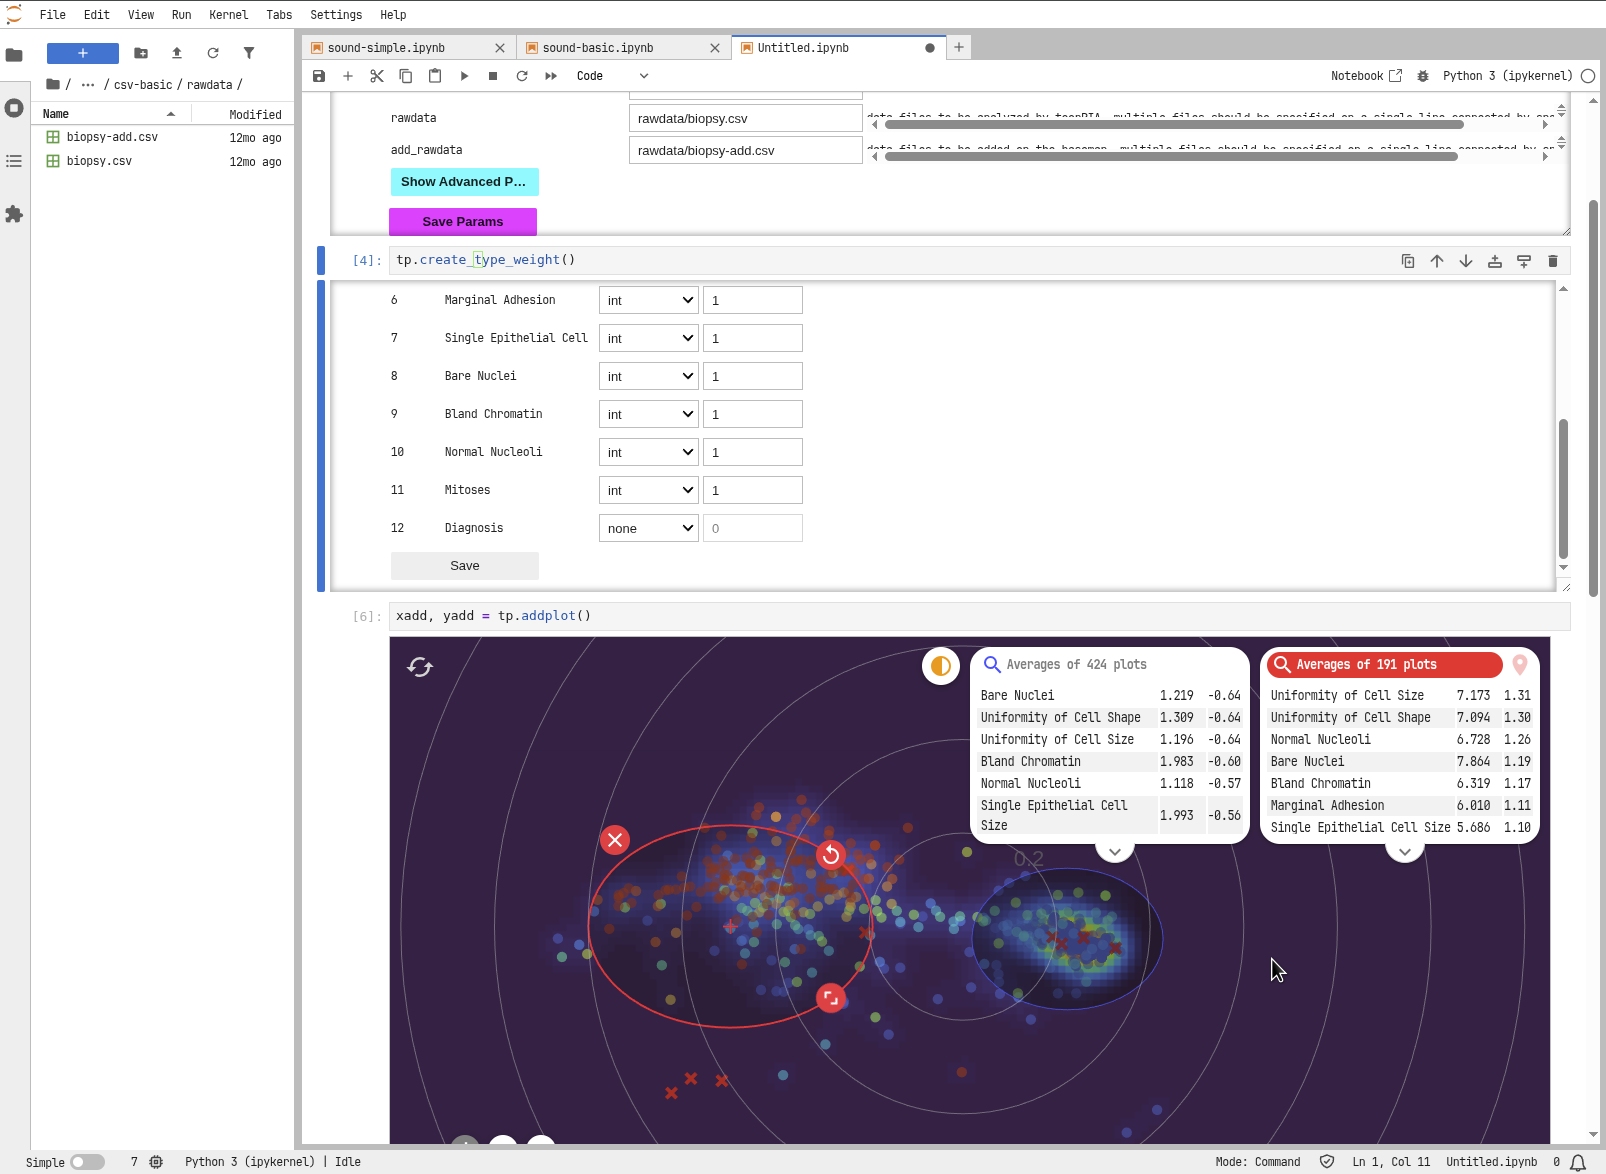
Where toorPIA excels
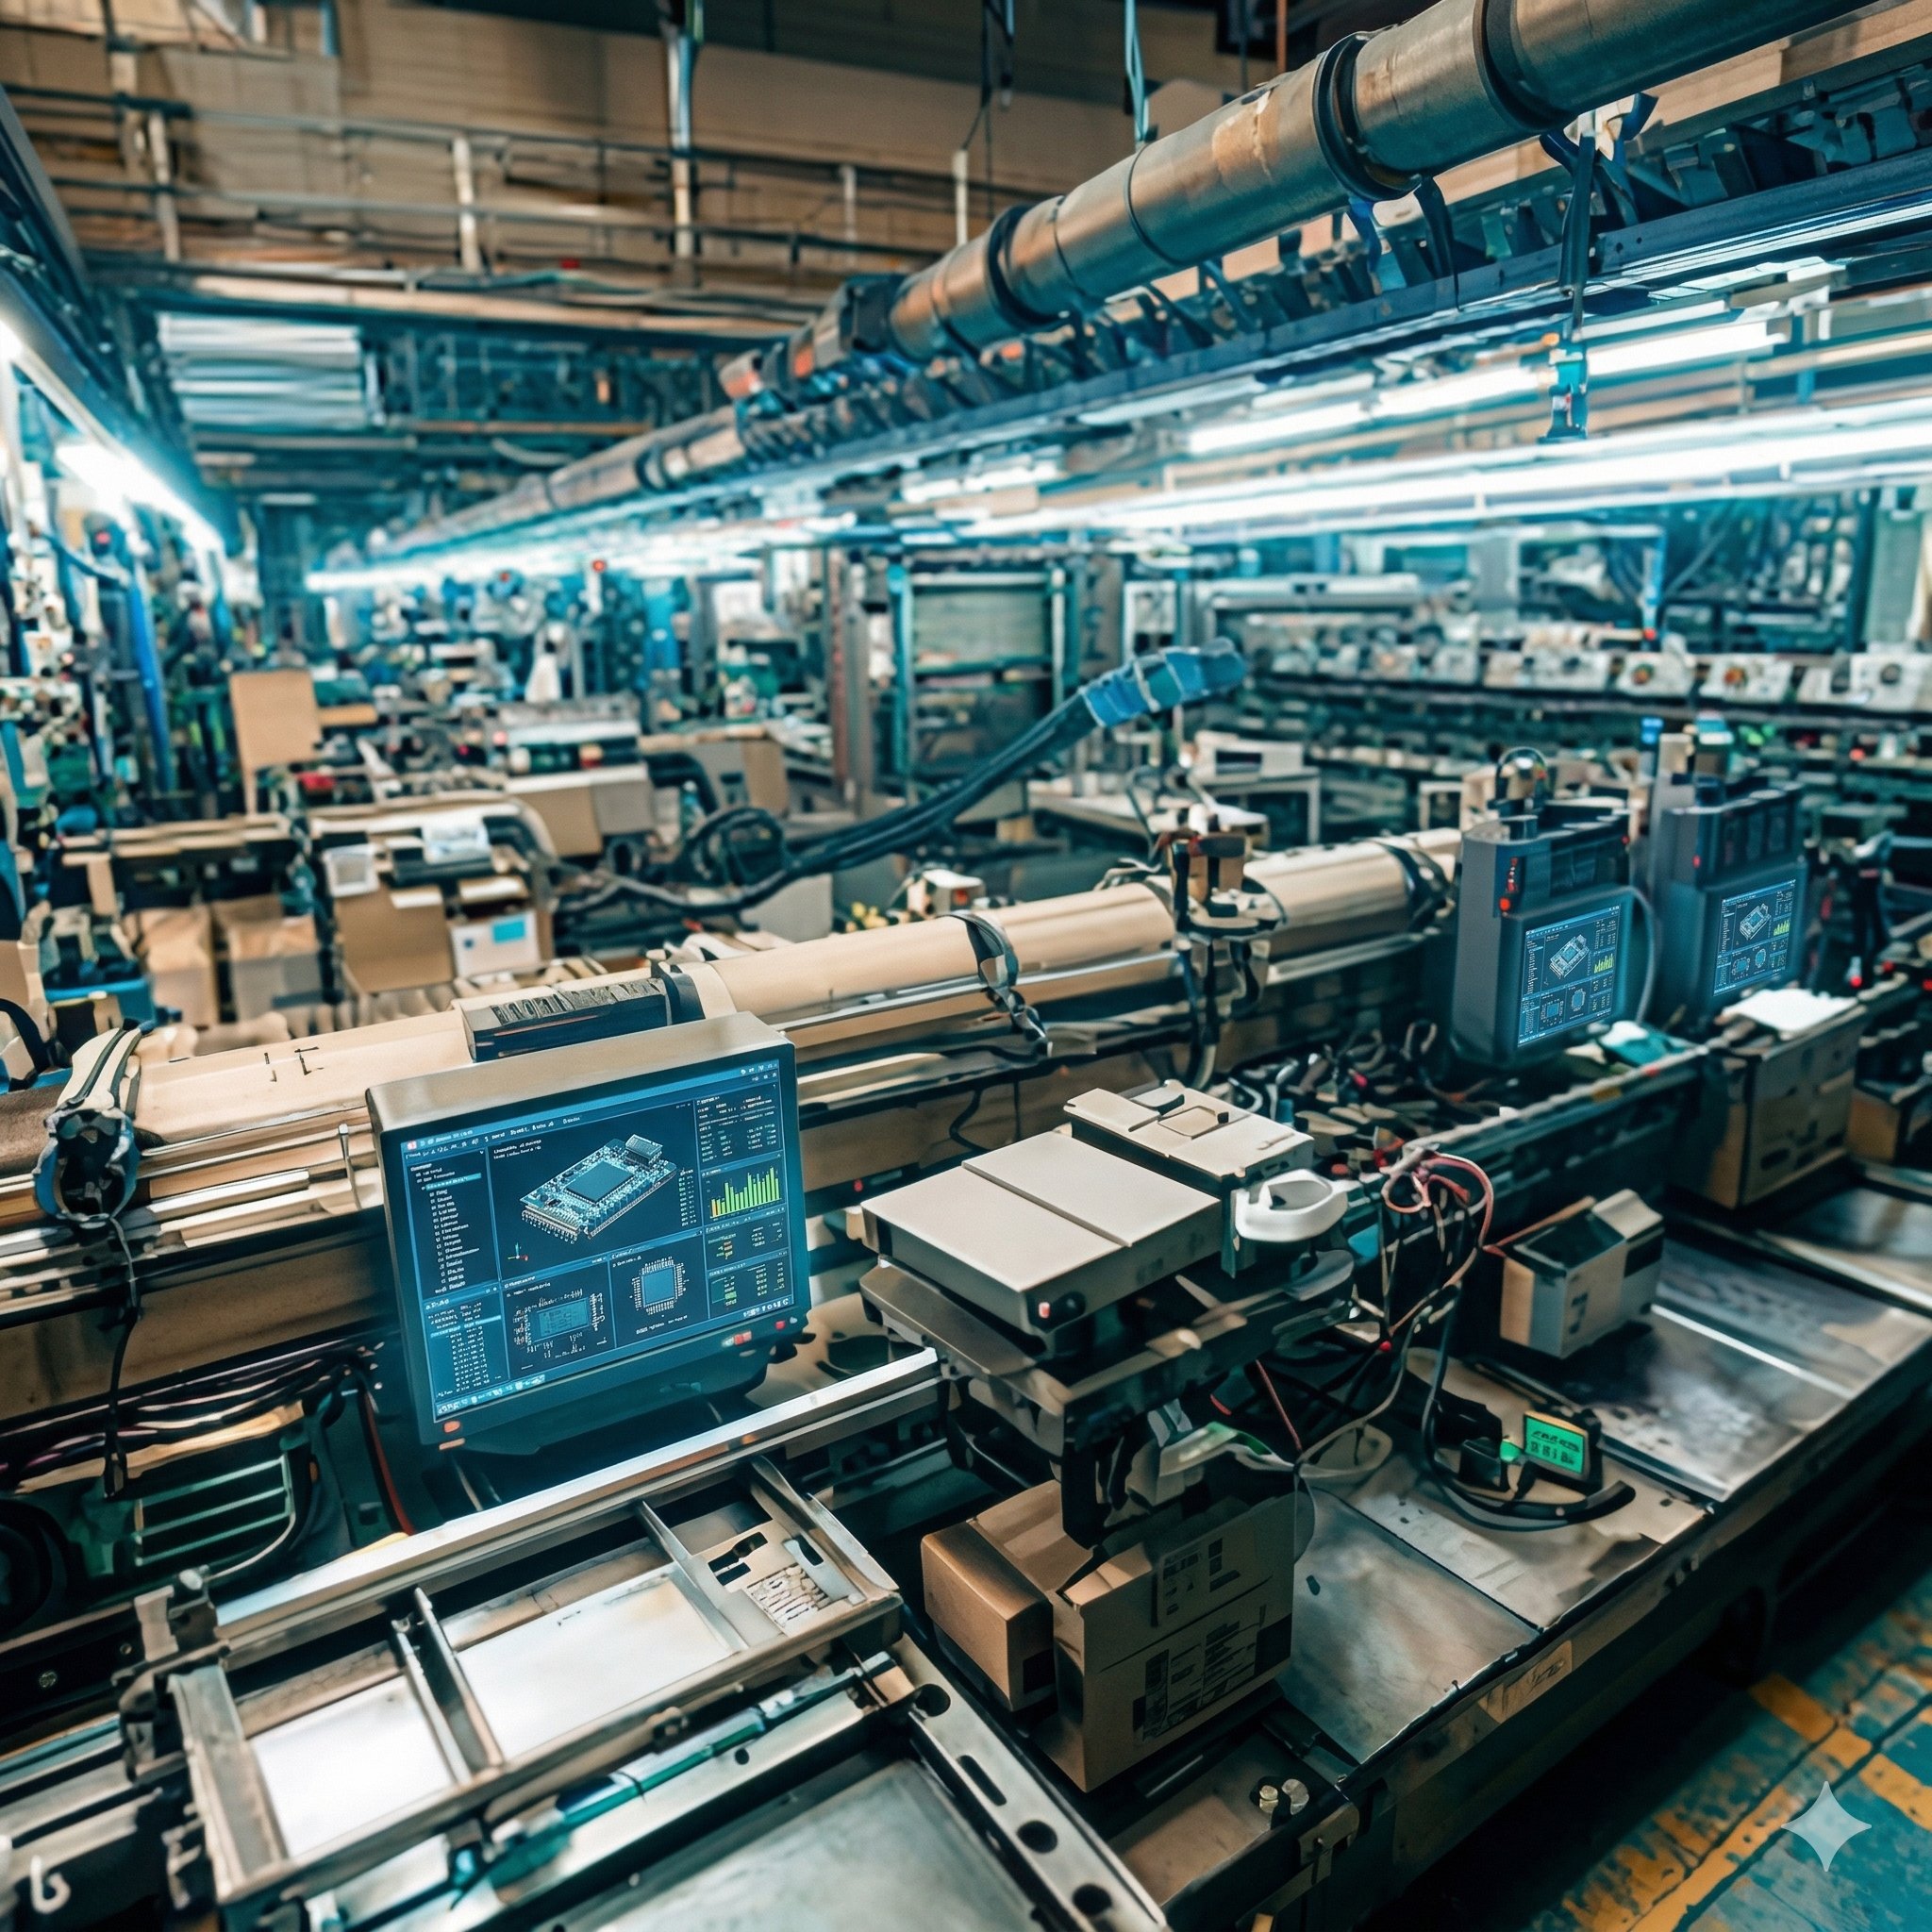
Predictive Monitoring in Manufacturing
Vibration and acoustic sensor data is filtered via DSP and converted to frequency spectra using STFT. The resulting high-dimensional vectors are projected into 2D by toorPIA, which automatically detects deviations from the normal-state basemap.
Thresholds are automatically derived from the normal-state basemap, eliminating the need for manual configuration. Effectiveness has been validated through proof-of-concept testing with a major chemical manufacturer (details available on request).
Internal Diagnostics for AI Models
Neural network intermediate layers exceed 1000 dimensions. In this range where t-SNE and UMAP structures collapse, toorPIA faithfully projects intermediate layer activation patterns into 2D.
In joint research with a university partner, we project the output-layer hidden states (1,000+ dimensions) of a locally hosted LLM with toorPIA to map how its outputs fluctuate across identical prompts — insight used for prompt optimization.
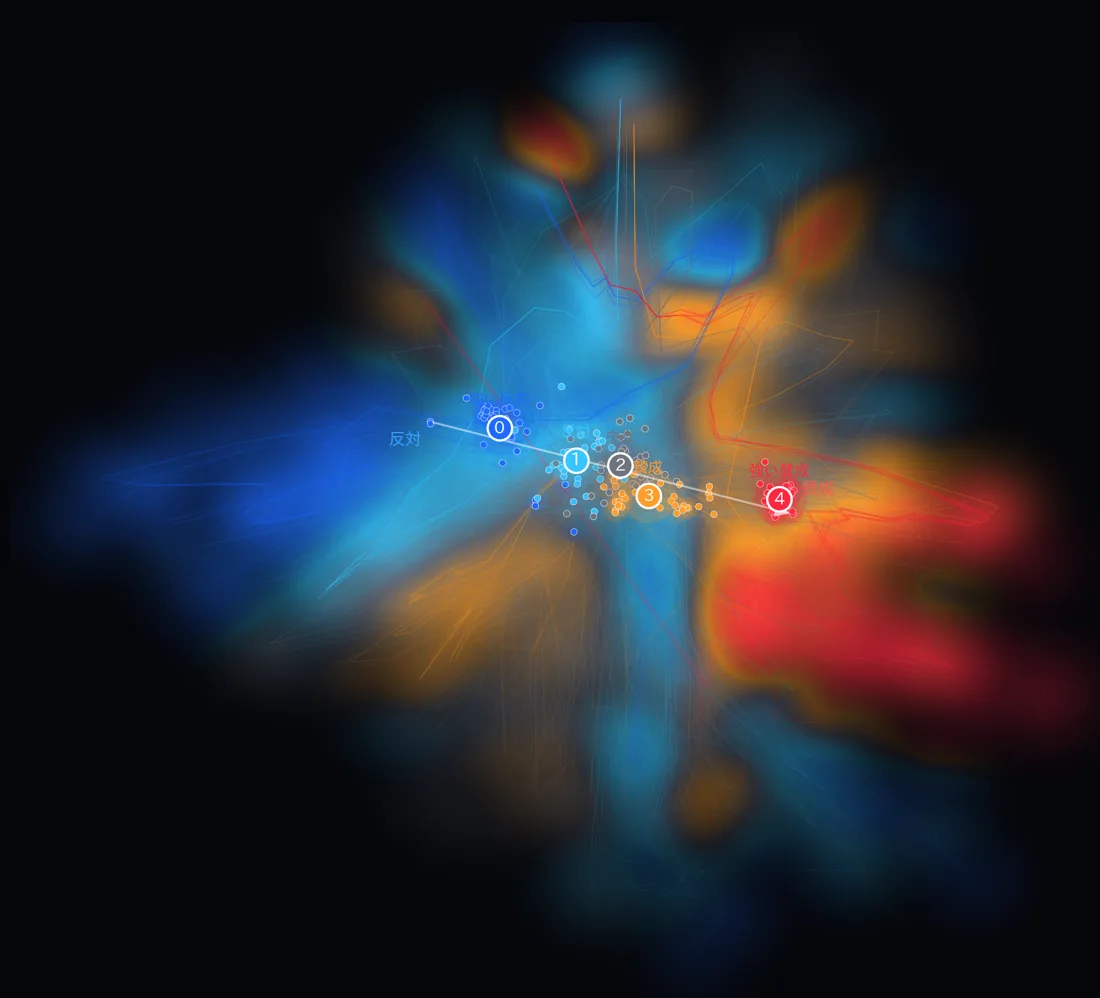
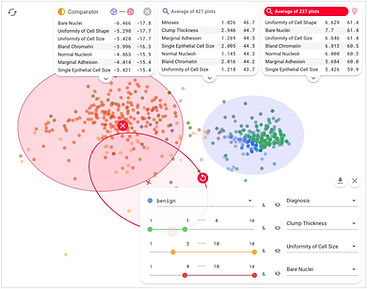
Interactive cluster analysis
Select any cluster on the projected 2D map and instantly compare key attributes (means and contributions) across clusters side by side. Pinpoint "what makes this cluster different from that one" based on data.
Because toorPIA does not destroy intermediate regions, it faithfully shows data points in transitional states between clusters — ambiguous data stays visibly ambiguous. It is precisely these data points that lead to the discovery of anomaly precursors and new patterns.
Capturing precursors in transitional states
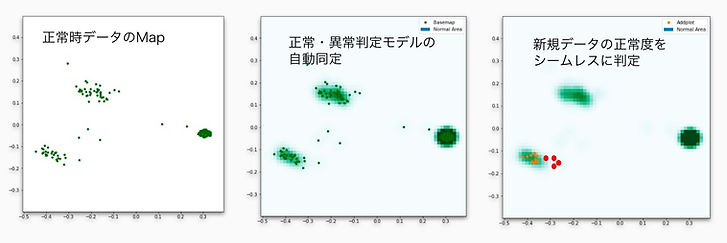
A basemap is created from sensor data during normal operation, learning the shape and spread of the normal region. When new data is introduced, the system tracks the gradual transition from the normal state, capturing precursory signs as changes in the intermediate region before they develop into full anomalies.
Built on the design philosophy of "Machines detect, humans decide," it continuously tracks transitions on maps of tens of thousands of points in the background. Personnel are notified as soon as changes emerge in the intermediate region, enabling action before anomalies fully develop.
Financial Risk Analysis
Market risk and portfolio states are represented as points in high-dimensional space. toorPIA's global distance preservation enables visualization while maintaining structural relationships between risk states.
Brain Science & Neuroscience
toorPIA's time-series structure preservation excels in analyzing high-dimensional trajectory data from brain activity. Visualization that balances local fluctuations and global directionality supports the exploration of neural activity patterns.
The PoC: a stepping stone, not the finish line
There is a critical gap between "we analyzed it" and "we can operate it." toorPIA provides an approach that bridges this gap.
Today: normal data, N = 1
Required: normal data, N = many
Using toorPIA and the open source tool stack (IF-HUB / toorpia client), the analysis environment built during the PoC becomes your production precursor monitoring platform. A 4-phase roadmap designed for production enables the fastest path to deployment decisions.
Get Started
Whether you have questions about deployment or technical inquiries,
feel free to reach out.