Mapping the
mind of an LLM.
Where an AI's stance starts to waver.
When a large language model produces an answer, a hidden state of thousands of dimensions (over 5,000 in some models) shifts inside it, token by token. Project that high-dimensional motion into 2D with toorPIA, and for the first time you can see how an AI forms a stance — and where it hesitates.
1,000sD
internal state (hidden state)
2D
mapped by toorPIA
0.91
stance continuity (Spearman)
We still judge AI by reading the text it outputs. But whether the model was confident or hesitant inside, whether it could express a continuous position — none of that is visible in the words alone. With toorPIA we visualize the internal state itself, to measure a quality of behavior that never surfaces in the text.
Stance comes into focus,
layer by layer
Asked “Is nuclear power the right energy policy?”, Qwen3-4B answers from an oppose and a support stance. In the shallow layers both are a single blurry cloud. As the layers deepen, blue and red separate sharply, weaving context-laden tokens into filament-like chains.
All 36 toorPIA layer-maps played in sequence. The ribbon marks the current layer; glowing lines are each stance’s representative answer.
Support vs. oppose isn’t black & white —
it’s a continuous gradient
Across five stance levels — strongly oppose → oppose → neutral → support → strongly support — 40 answers each (200 total), mapped from every token’s internal state onto one map. Stance is not a discrete Yes/No but a continuous axis written into the internal state (Spearman = 0.91 against the stance axis).
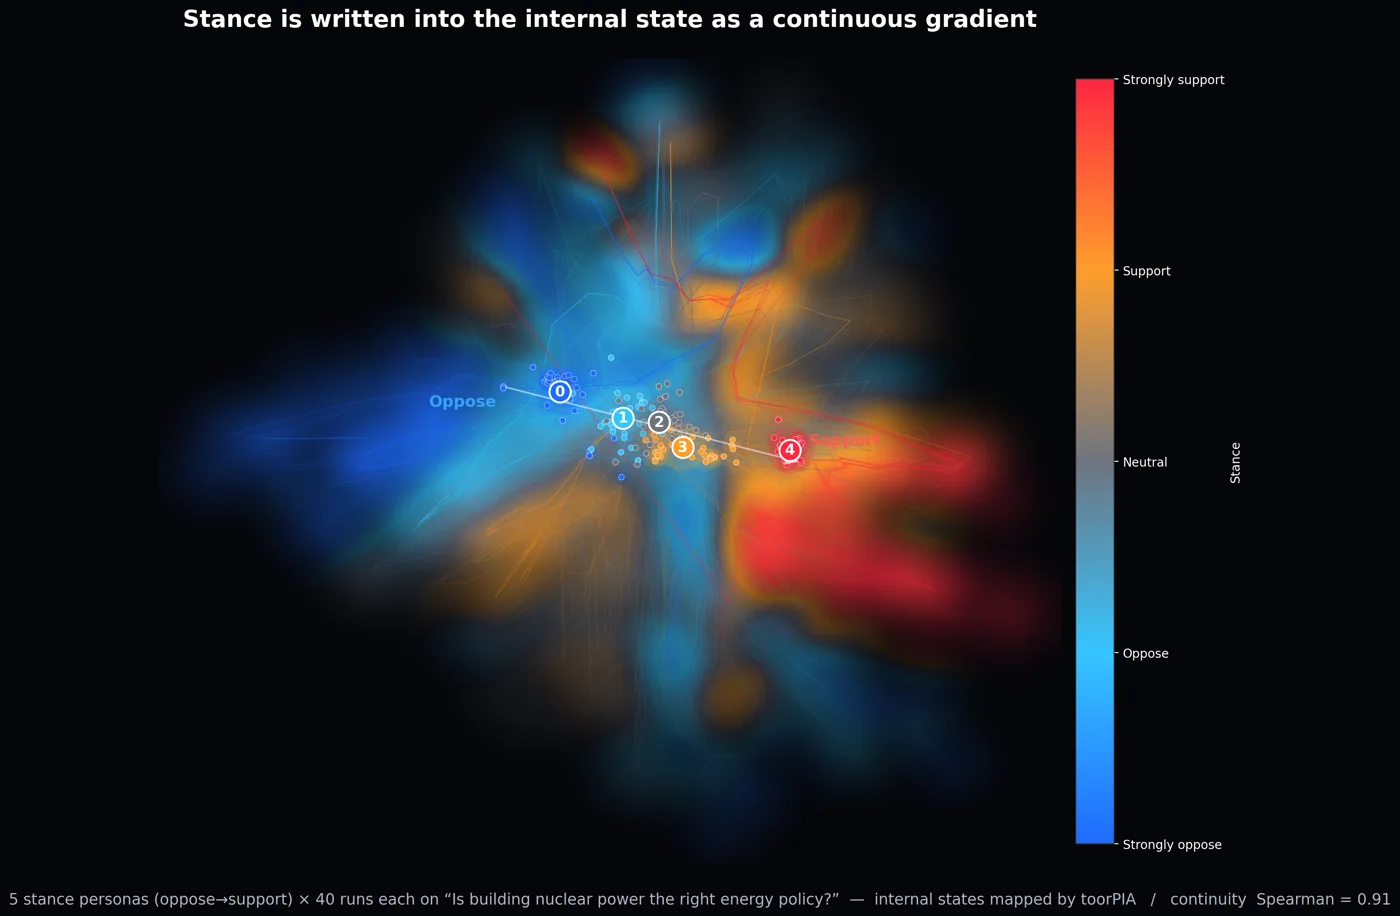
Sweeping stance s from oppose to support makes the matching region glow and move continuously (left). The five centroids line up smoothly from oppose (blue) to support (red) (right).
The neutral stance wavers most
Answer the same question many times at the same temperature, and the internal trajectory differs slightly each time — the model’s “wobble.” Measuring the spread around each stance’s representative answer (its core), the neutral stance wavers most at every layer (about 2.5–3.5× that of strongly-oppose / strongly-support). The more committed the stance, the tighter the internal state — a signal of decisiveness and confidence invisible in accuracy or text.
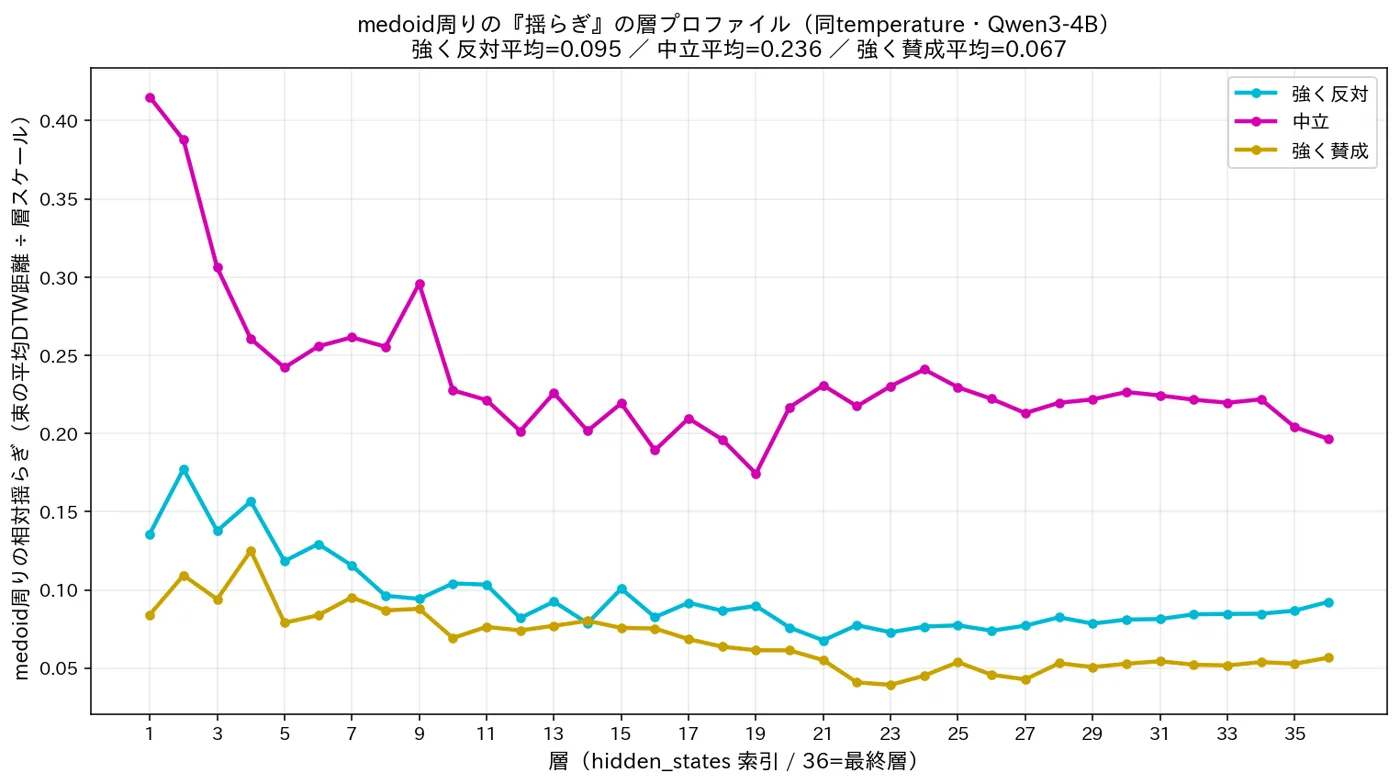
The magenta curve (neutral) sits clearly above cyan (strongly oppose) and gold (strongly support) across all layers. Temperature is held equal in every condition, so the gap comes from the model’s internal state, not temperature.
Measuring AI quality without reading the text
Benchmark accuracy grades the “output text,” often leaning on another AI or human preference. We aim instead to quantify consistency, confidence, and stance continuity from the internal state itself, independent of any external judge, and reproducibly. The starting point is toorPIA’s visualization of high-dimensional data. Coarse-graining the internal “trajectory” opens the door to describing it in physics-derived language (persistence length and other descriptors) — a step toward a scientific axis for evaluating LLMs.
Note: this page is an introduction to the research. Some observations shown here are exploratory, and their validity will be quantified further in future work.
Let’s talk about what comes next.
For applications to LLM interpretability and quality evaluation, demos, or research collaboration, please reach out — we’re glad to walk you through the details in person.
Figures and videos include toorPIA output. © 2026 toor Inc. / MIT License