Why does toorPIA work in
thousands of dimensions?
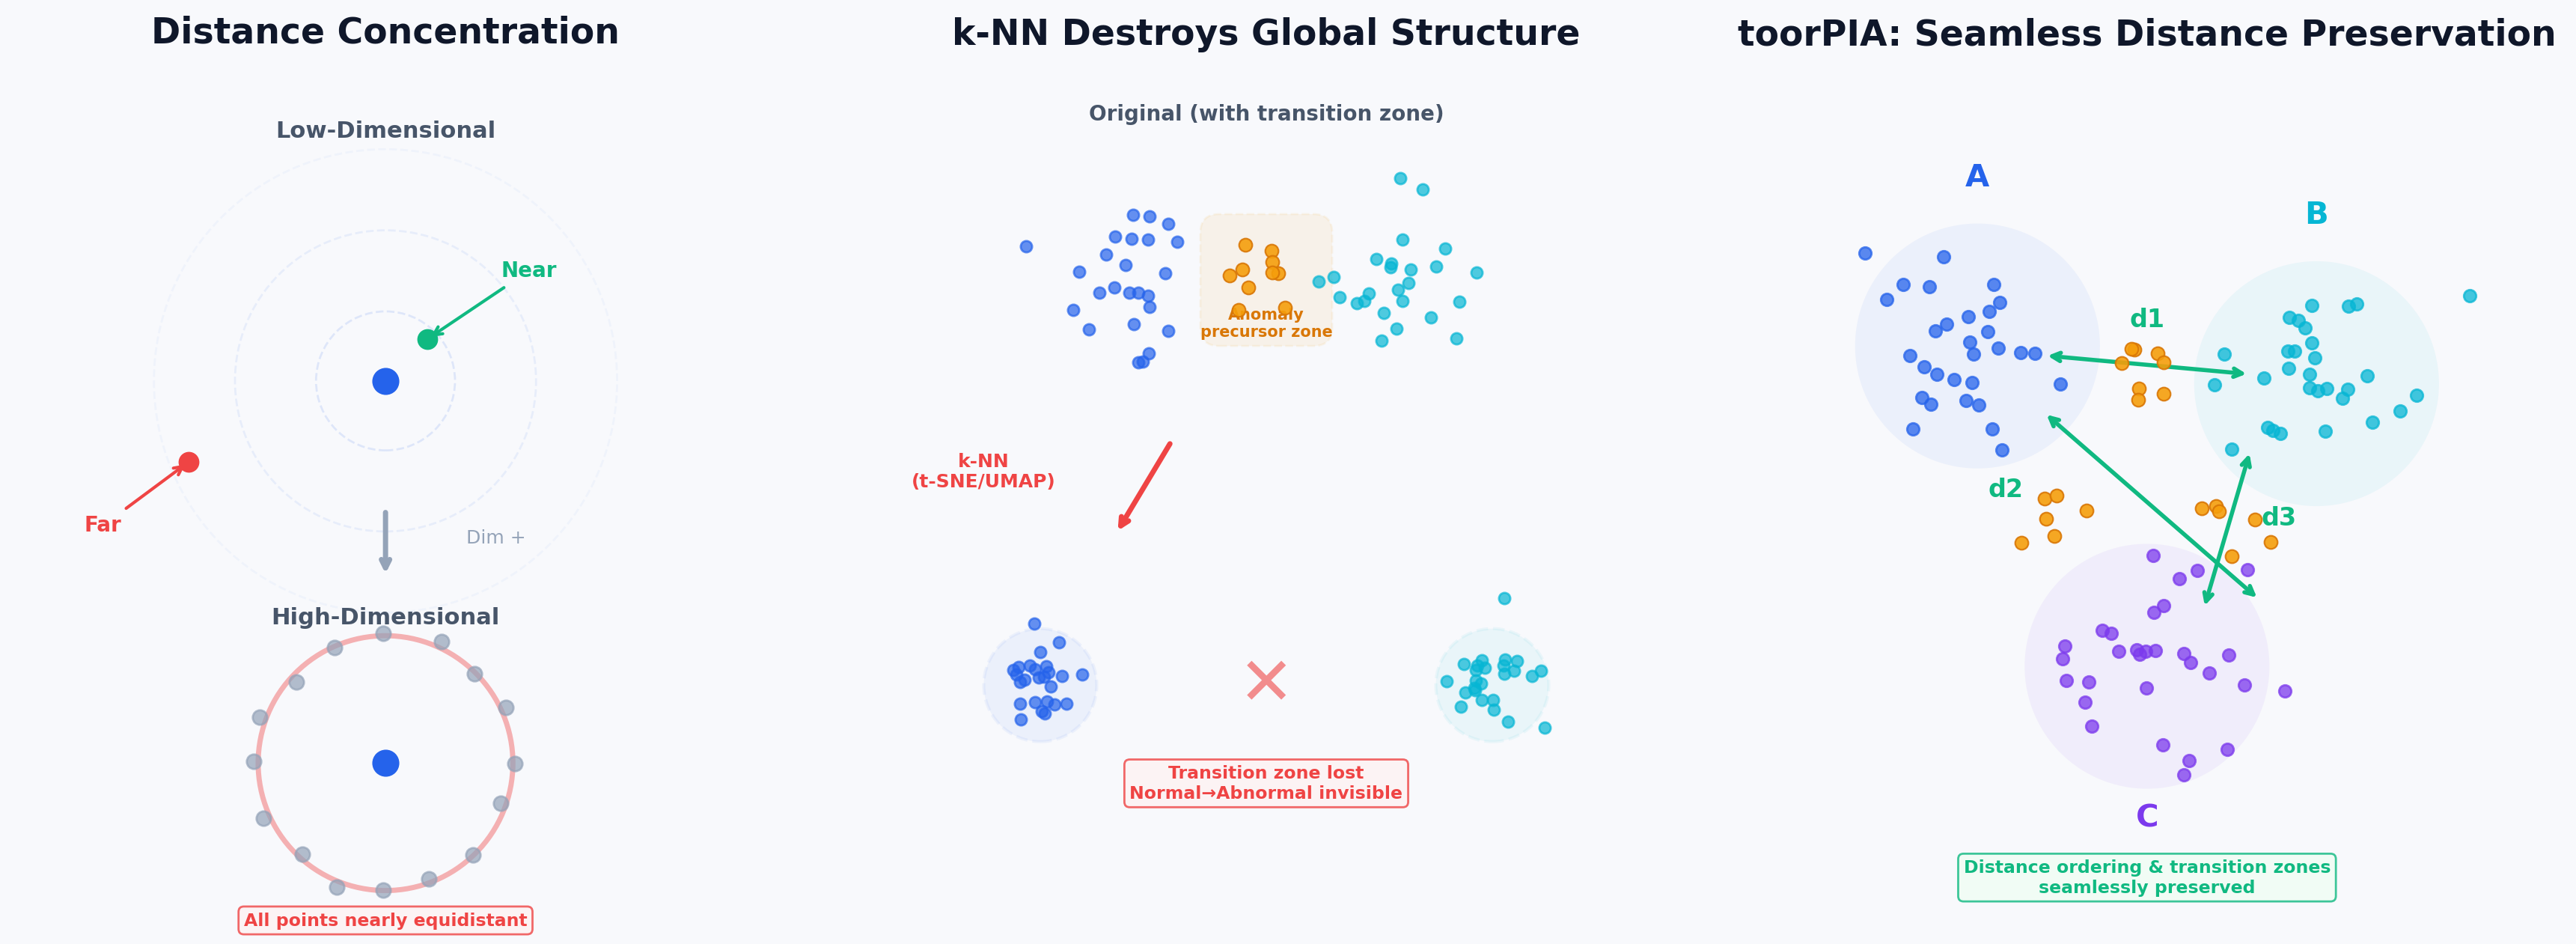
By "dimensions" we mean the number of numeric columns in your data. Decompose a single vibration measurement into its frequency components and you get thousands of values — that is data in "thousands of dimensions." In such high-dimensional spaces, the "distance concentration phenomenon" occurs, causing all pairwise distances to become uniform. In this space where the concept of neighborhood collapses, conventional k-NN-based methods structurally break down. toorPIA avoids this problem through a fundamentally different design that does not use neighborhood graphs.
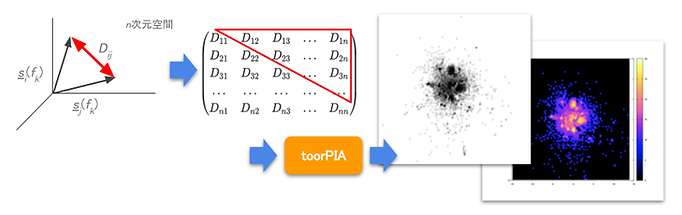
Preserves the closeness relationships among your many numeric values and draws them onto a 2D map (heatmap / scatter plot)
Distance Concentration Phenomenon and Collapse of Neighborhood Graphs
Limitations of Conventional Methods
Leading existing methods such as t-SNE, UMAP, and PyMDE depend on building a "neighborhood graph" — points connected by lines to whichever points sit nearest them. They identify "which points are near this point" and arrange them in 2D to preserve these local connections.
However, in high-dimensional spaces, the "distance concentration phenomenon" occurs, where all pairwise distances become roughly equal. Near and far points become indistinguishable, and the neighborhood graph itself becomes unreliable.
Furthermore, the attractive forces within each cluster (a group of similar data points) distort the true distance relationships between clusters, destroying intermediate regions that should be continuous.
toorPIA's Approach
toorPIA does not use neighborhood graphs at all. It projects the closeness relationships across the entire dataset — the global Euclidean distance, simply how far apart two points are — directly into 2D.
Since there is no neighborhood parameter — the "how many points to treat as nearby" setting that other methods make you tune — it can be applied to sensor data of unknown characteristics without any trial and error.
This design makes toorPIA inherently resistant to the distance concentration phenomenon, so it can represent data in the thousands of dimensions while preserving its true structure. This holds even when many irrelevant noise columns are mixed in — not because they are stripped out in preprocessing, but because the method itself is robust to noise.
Even at 6,000 dimensions, toorPIA still tells states apart
On data where the meaningful signal hides in just a few columns and every other column is pure noise, we compared eight leading dimensionality-reduction methods under identical conditions. While the others lose the ability to tell states apart (for example, whether equipment is normal or abnormal) early on, toorPIA kept distinguishing them to the highest dimensionality of all. On top of that, toorPIA's standard analysis pipeline has been confirmed to tell states apart even at 6,000 dimensions. The code, data, and every method's output are published on GitHub, so anyone can reproduce the result.
6,000 dims
toorPIA's standard analysis pipeline tells states apart even at this dimensionality
8 methods compared
benchmarked against leading methods under identical conditions
Reproducible
code and data published with a DOI — anyone can reproduce the result
4 Technical Advantages
The core algorithm's implementation is not public. Its externally verifiable properties, however — the same data always yields the same map, compute time scales linearly with data volume, and no tuning parameters are needed — can be checked by anyone in the open benchmark.
Preservation of Global Euclidean Distances
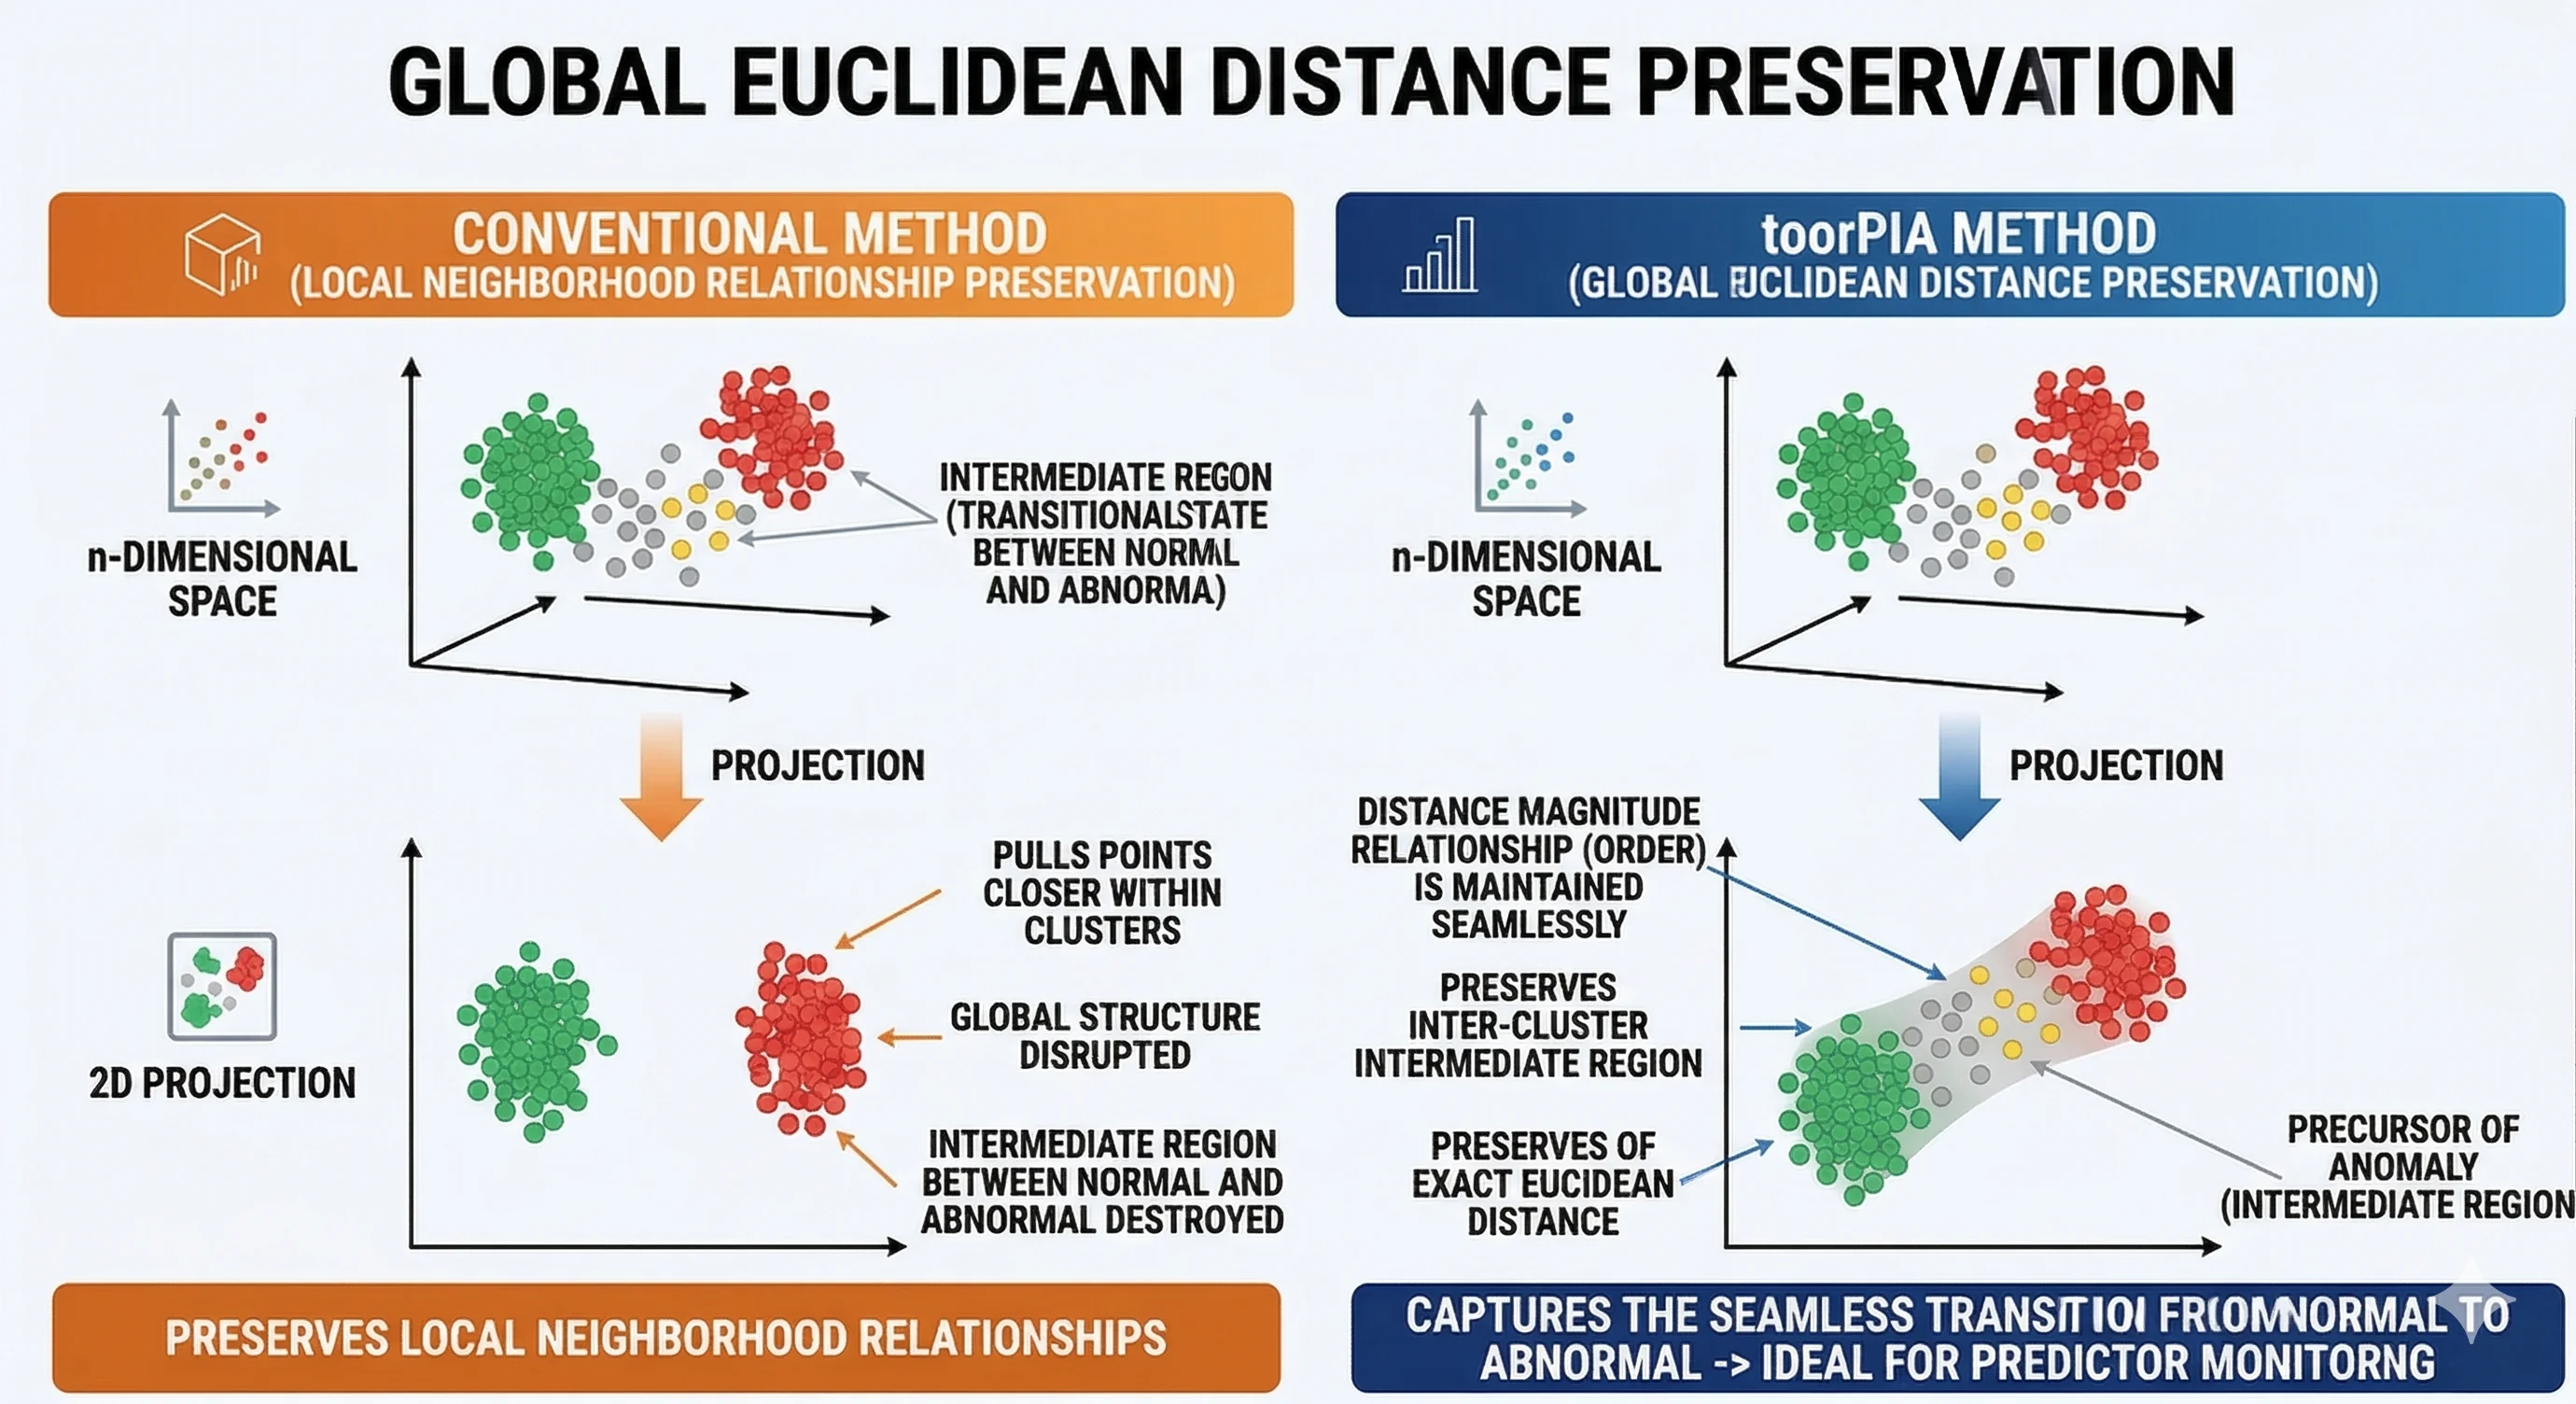
Conventional methods preserve local neighborhood relationships, but toorPIA projects the Euclidean distances themselves from n-dimensional space into 2D. While absolute ratios are distorted by dimensionality compression, toorPIA is designed to preserve the relative ordering of distances as faithfully as possible. No method can strictly preserve every distance relationship when compressing to 2D. So we verify how faithfully toorPIA preserves structure in an open benchmark, and confirm it preserves structure most faithfully among the leading dimensionality-reduction methods. Unlike k-NN methods, toorPIA does not pull intra-cluster points together at the cost of severing global structure.
This design ensures that the intermediate regions between clusters — transitional states between normal and abnormal — are not destroyed. While k-NN methods eliminate intermediate regions by pulling intra-cluster points tightly together, toorPIA honestly represents ambiguous data as ambiguous.
Since early signs of anomalies often first appear in these intermediate regions, being able to preserve them without destruction is critically important for predictive monitoring in manufacturing. (The same property is also useful in AI model development — see "AI Model Internal Diagnosis" below.)
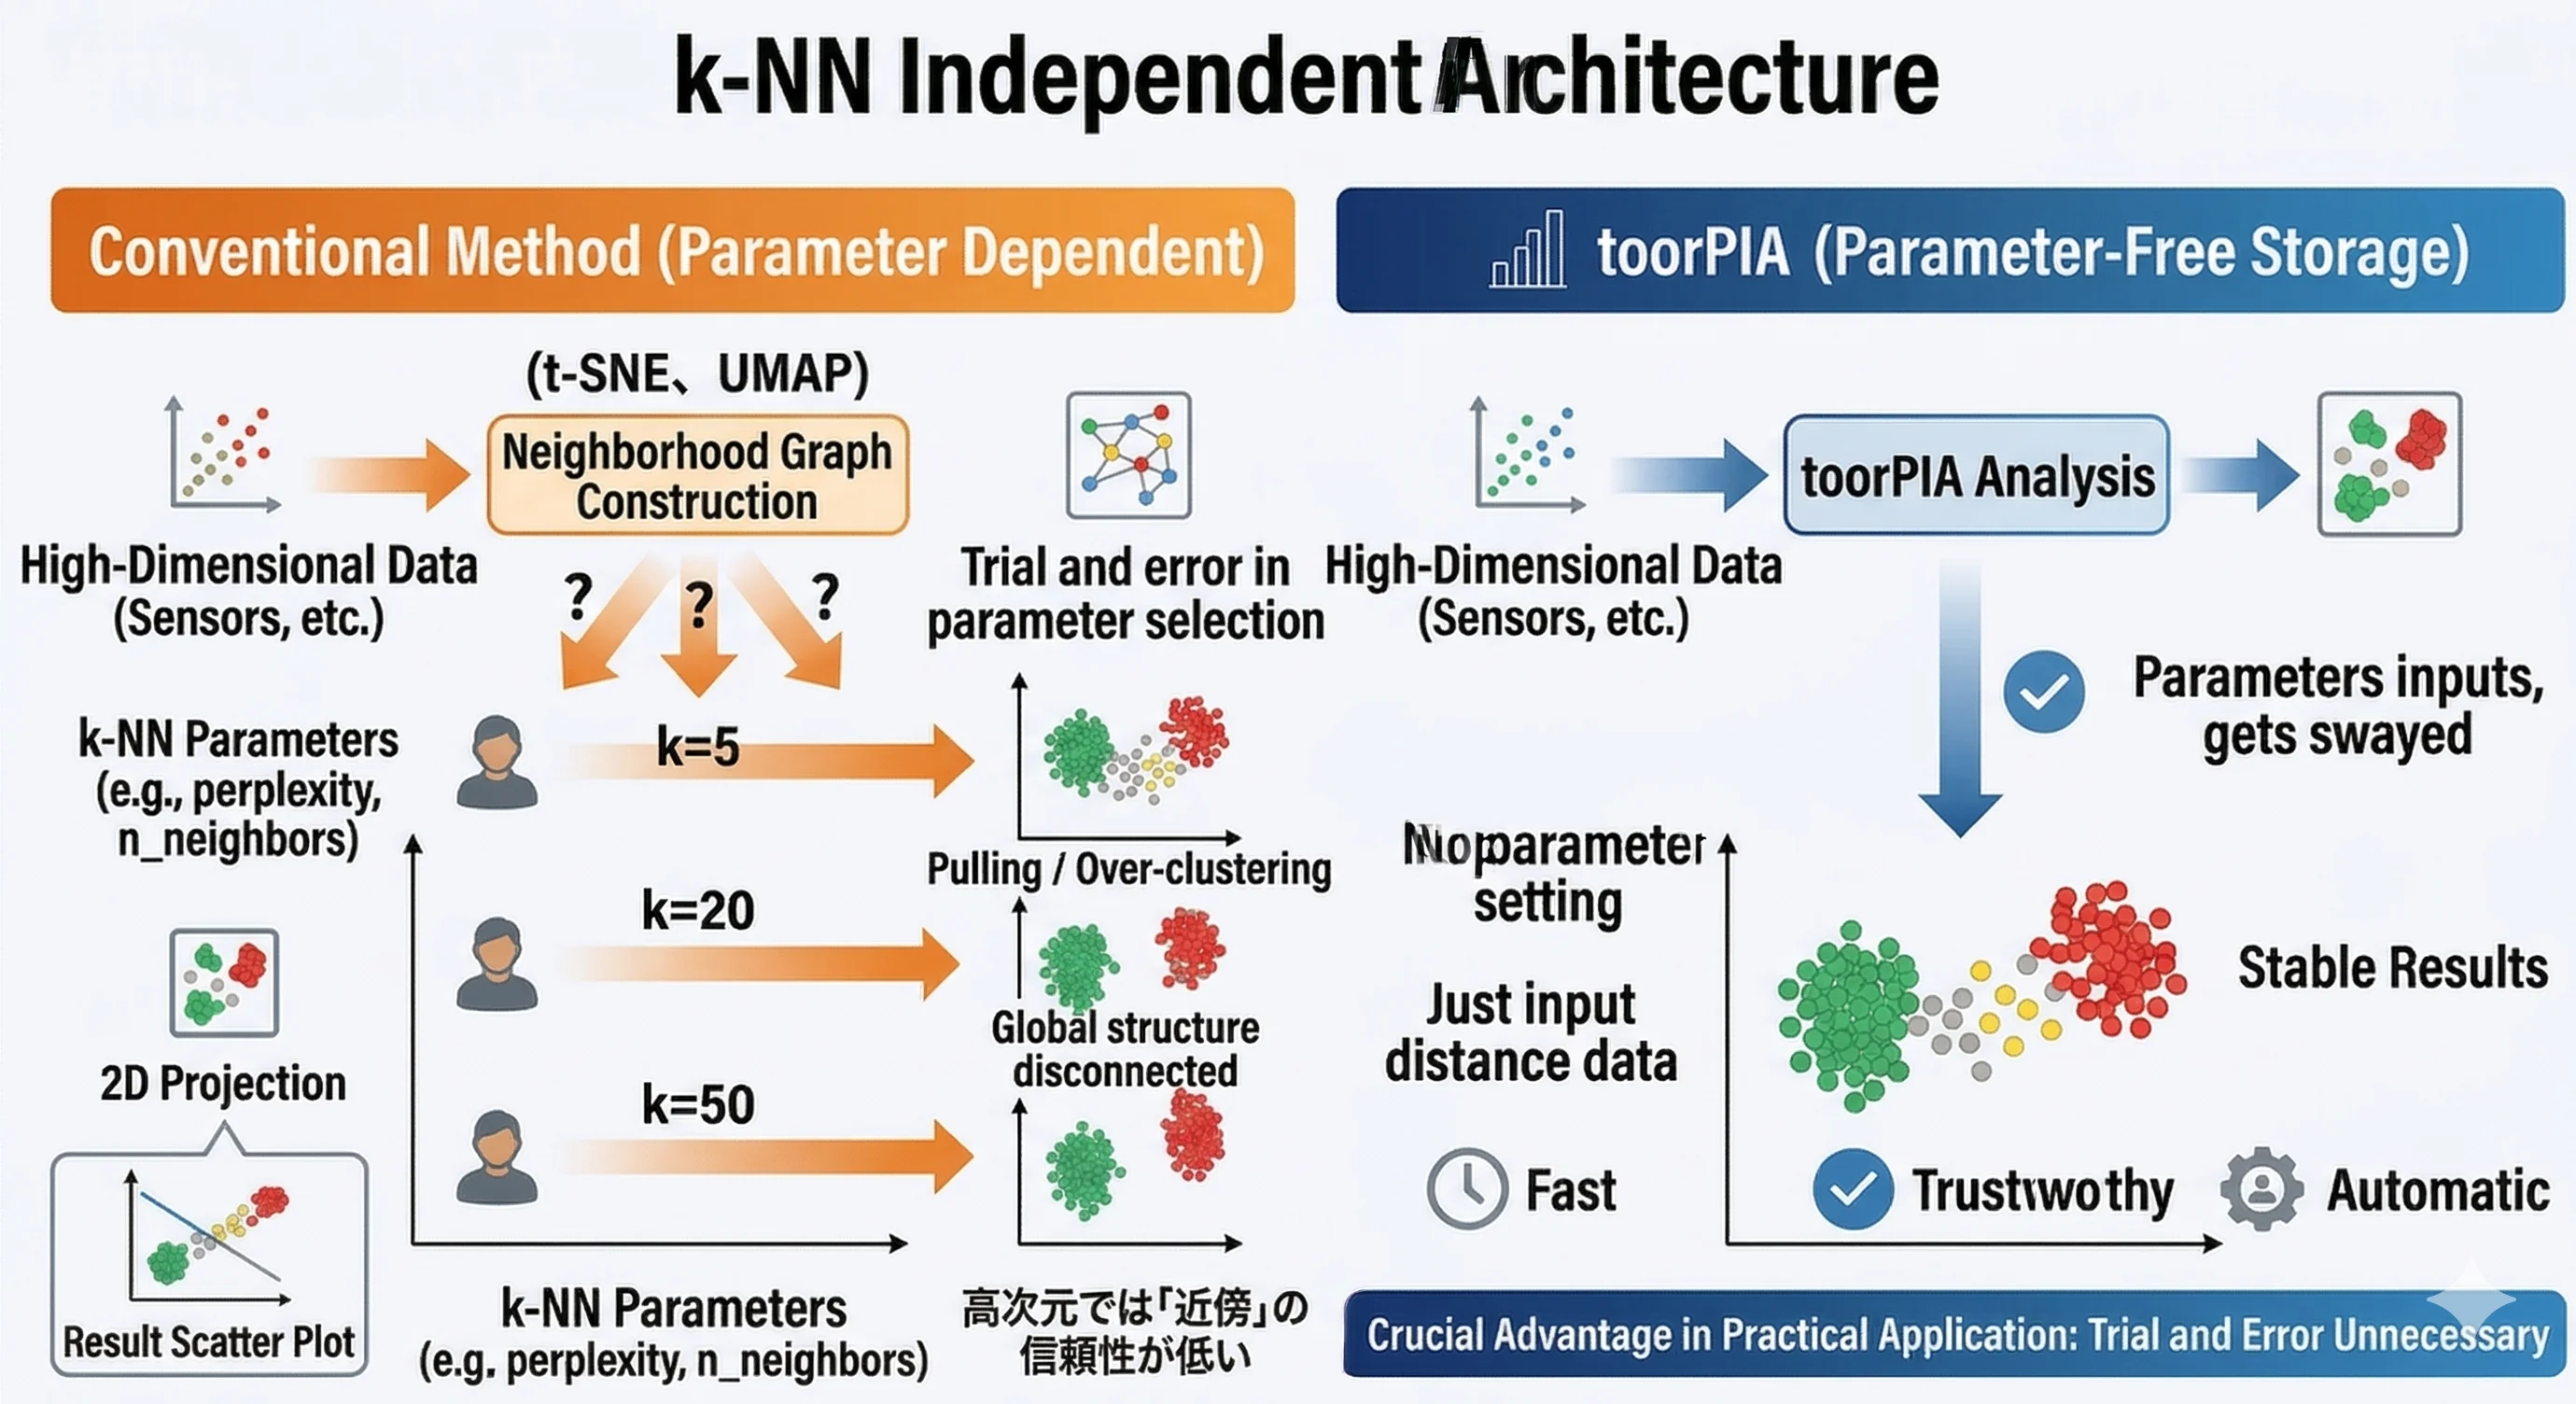
k-NN Independent Architecture
t-SNE's perplexity and UMAP's n_neighbors are parameters that determine "how many points to consider as neighbors." The choice of these parameters significantly affects results, yet in high dimensions, "neighborhood" itself is unreliable.
toorPIA does not have this parameter. Since there is no step to construct neighborhood graphs, results are obtained simply by feeding in the data, even for sensor data of unknown characteristics. In production environments, this "no trial and error needed" property is a decisive advantage.
High-Fidelity Preservation of Time-Series Structure
The open benchmark uses eight trajectories (500 steps each) that radiate from the origin in eight different directions. Each trajectory advances with small random jitter, like an unsteady gait. This simulates the real-world scenario of multiple sensors each varying with distinct trends in a manufacturing setting.
The key question: can a method represent both the small jitter at each step (local) and the overall direction each trajectory heads in (global)? t-SNE and UMAP tangle the trajectories and lose the eight-way arrangement; PCC smooths them, erasing the fine jitter. Only toorPIA keeps both the eight radial directions and the step-by-step fluctuations — leading all eight methods on all three distance-fidelity readouts. This property is essential for tracking time-series changes such as equipment aging and degradation. See the time-series benchmark
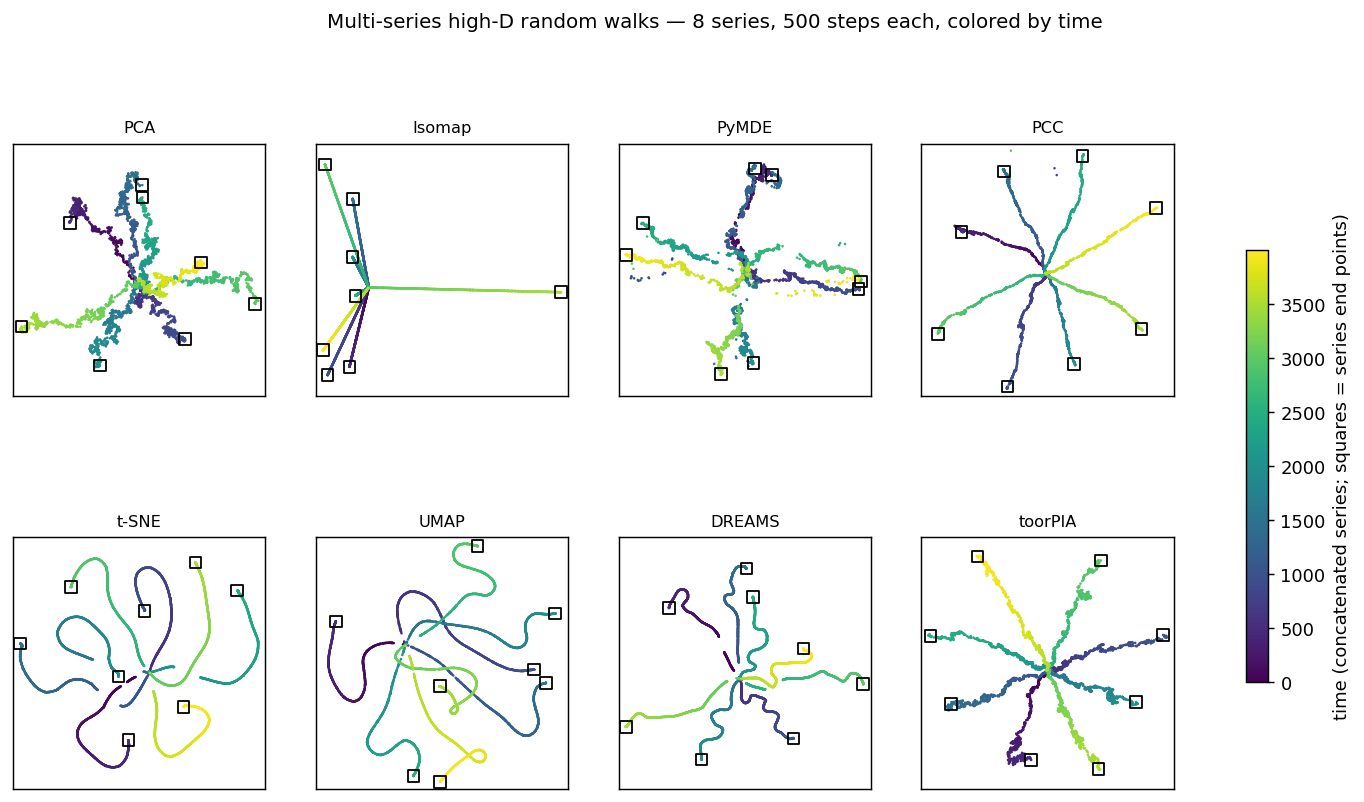
From the open benchmark: eight random walks (500 steps each, colored by time) projected to 2D by each method. Only toorPIA keeps both the eight radial directions and the local fluctuations.
O(n) Computational Complexity, No GPU Required
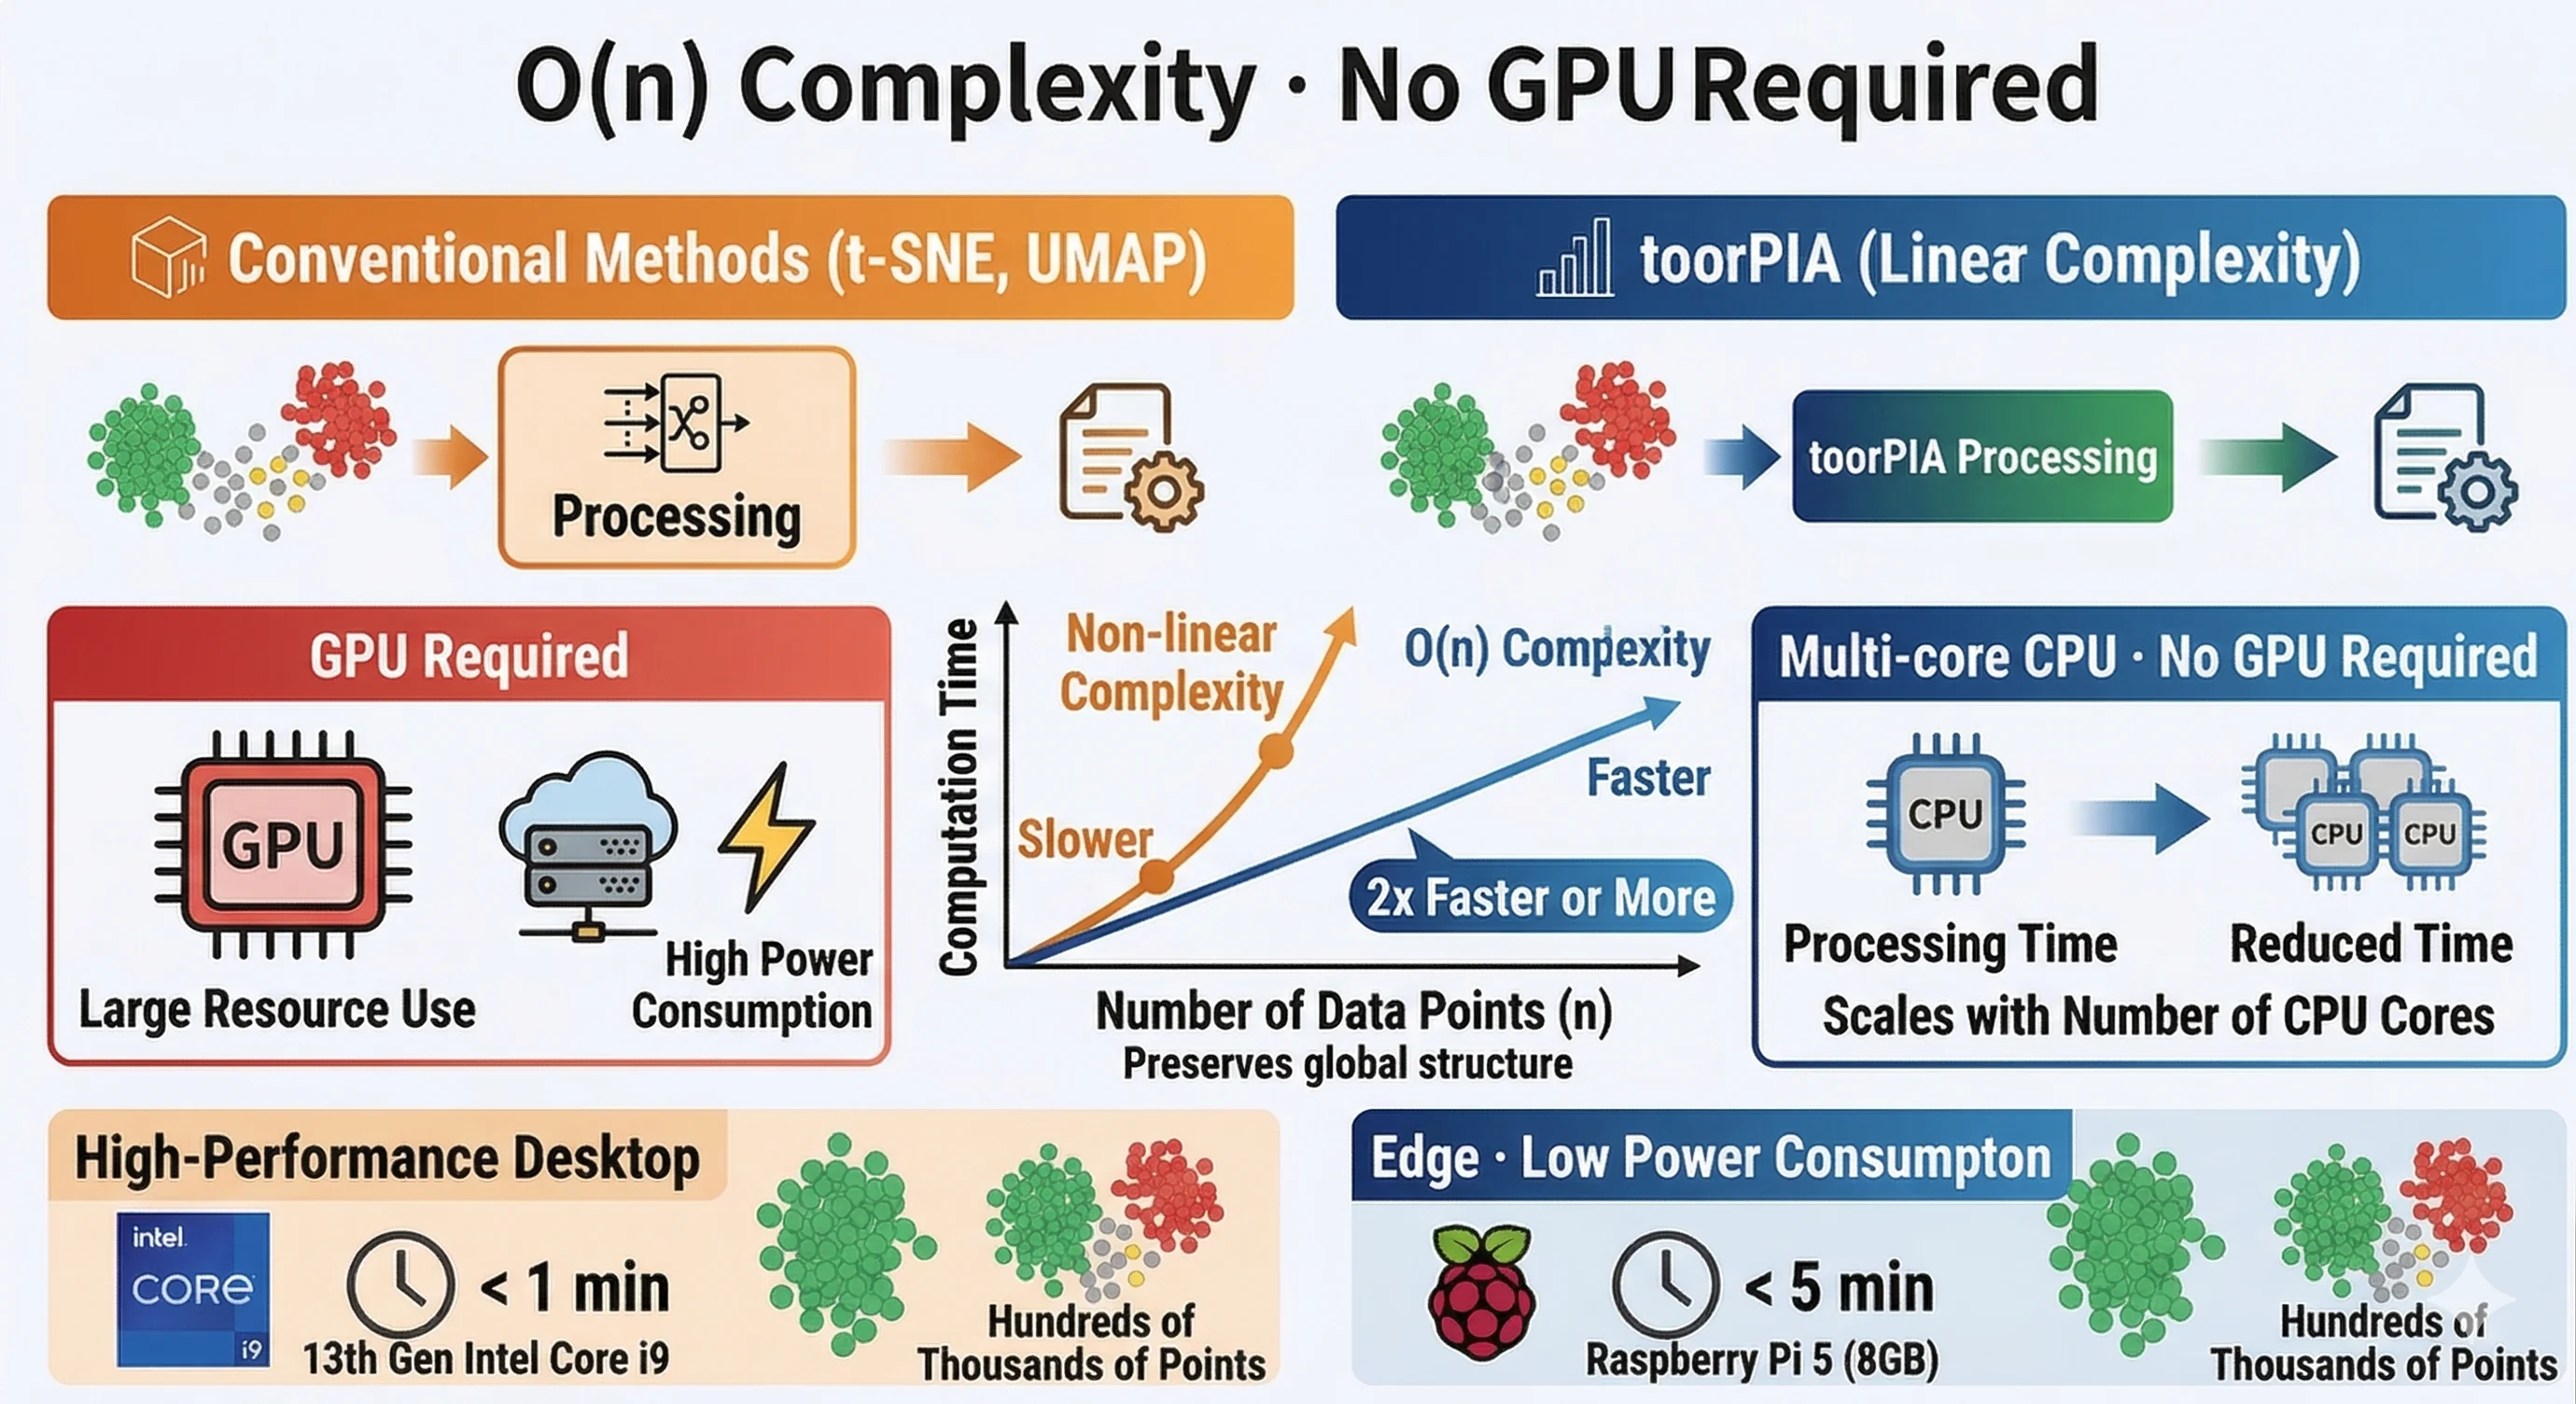
Computational complexity is linear with respect to the number of data points. No GPU is required — a CPU alone processes hundreds of thousands of points in under a minute (in-house measurements below), scaling with the number of CPU cores.
| Hardware | Hundreds of thousands of points |
|---|---|
| 13th Gen Intel Core i9 | < 1 min |
| Raspberry Pi 5 (8GB) | < 5 min |
How Precursor Monitoring Works
"Machines detect, humans decide" — toorPIA's precursor monitoring system continuously tracks a map of tens of thousands of points in the background, notifying personnel as soon as changes emerge in the intermediate region between normal and abnormal states.
Two-Stage Composite Assessment
Perspective 1: Inside/Outside the Normal Region
Defines the normal region from the basemap during normal operation. Handles complex shapes (concavities, island structures) and determines whether new data falls inside or outside the region.
Perspective 2: Distance from Centroid (Rg)
Uses the distance Rg from the centroid of the normal region to peripheral points as a reference value. Up to 2×Rg is classified as warning; beyond that is classified as danger. Thresholds are automatically derived from basemap geometry.
Inside the normal region
Outside region and centroid distance ≤ 2×Rg
Outside region and centroid distance > 2×Rg
Verified by Open Benchmark
This operation — building a map from normal data only, then adding unseen anomalies — was verified in an open benchmark against seven other methods. Only toorPIA placed the anomalies outside the normal region (9.7× its radius) with their directions pointing at the source cluster (attribution 10/10, accuracy 1.000). t-SNE, PyMDE, and PCC cannot perform the operation at all, while PCA, Isomap, UMAP, and DREAMS bury the anomalies inside the normal region.
See the benchmark in detailAI Model Internal Diagnosis
From here on, these are applications for people who build and study AI models. Hidden states of neural networks exceed 1000 dimensions. toorPIA faithfully projects the structure of this high-dimensional space into 2D, enabling direct observation of the "structural causes" rather than just the "results" of a model.
Stepwise Visualization of Embedding Spaces
For example, visualizing the intermediate layers (128 dimensions) of a model trained on MNIST with toorPIA clearly reveals the distribution structure of each class in the embedding space.
- Step 1 Display the training data embedding space to confirm the learned representation structure
- Step 2 Overlay validation data to visualize recognition accuracy on unseen data
- Step 3 Inject mirror-flipped data to measure the model's transformation invariance
Structural Detection of Overfitting
Overfitting leaves clear traces not only in model output accuracy but also in the spatial structure of hidden states. toorPIA's intermediate region preservation makes this detection possible.
Overfitted Model
Clusters become excessively separated, and intermediate regions between classes vanish. Misclassification becomes frequent for data points near boundaries.
Properly Trained
Continuous intermediate regions are maintained between clusters, confirming that the model appropriately represents "ambiguity."
LLM Output Stability Analysis and Neural Collapse
In collaborative research with universities, output layer hidden states (1000+ dimensions) of local LLMs are mapped with toorPIA to structurally analyze output fluctuations for identical prompts. Additionally, toorPIA's global distance preservation is being leveraged to visualize "Neural Collapse" — the phenomenon where intermediate layer representations converge to specific symmetric structures in the final stages of deep learning. These studies aim to apply findings to prompt optimization and output stabilization.
See the full study — mapping the mind of an LLM — on the Research pageWant to Learn More About the Technology?
Feel free to contact us for case studies and technical details.
Contact Us